Oil prices have rallied more than 10% since their December lows, with West Texas Intermediate (WTI) crude threatening to break out of a six-month downtrend. This surge has drawn attention to key technical levels, as traders analyze weekly, daily, and intraday charts to navigate potential next moves.
Crude Oil Technical Outlook
WTI prices have broken out of a multi-week range and are challenging resistance levels set during a six-month downtrend. The rally has shifted focus to key levels on the charts:
- Resistance Levels:
- $73.87 – $73.91 (October high-day close and 61.8% retracement of October’s decline)
- $75.55 – $75.60 (1.618% extension of the December rally)
- $77.15 – $78.00 (key upper threshold)
- Support Levels:
- $71.90 – $72.45 (defined by the 2025 yearly open and key historical lows)
- $71.33 (critical support to maintain breakout validity)
- ~$70.00 (broader bullish invalidation zone)
Weekly Chart Insights
WTI broke above the 2024 yearly open of $71.33 after trading in a well-defined range. The current rally highlights the importance of the weekly close relative to this level. Sustaining gains above $71.33 reinforces the bullish breakout scenario, while a failure could invite renewed selling pressure.
Daily Chart Dynamics
Daily charts show WTI testing the upper boundary of a descending pitchfork that has constrained prices since July. The advance met resistance near $73.87-$73.91 but requires a decisive breach and daily close above this zone to validate the breakout and confirm the resumption of the uptrend. Immediate support rests at $71.90-$72.45, with a break below potentially testing the $71.33 key level.
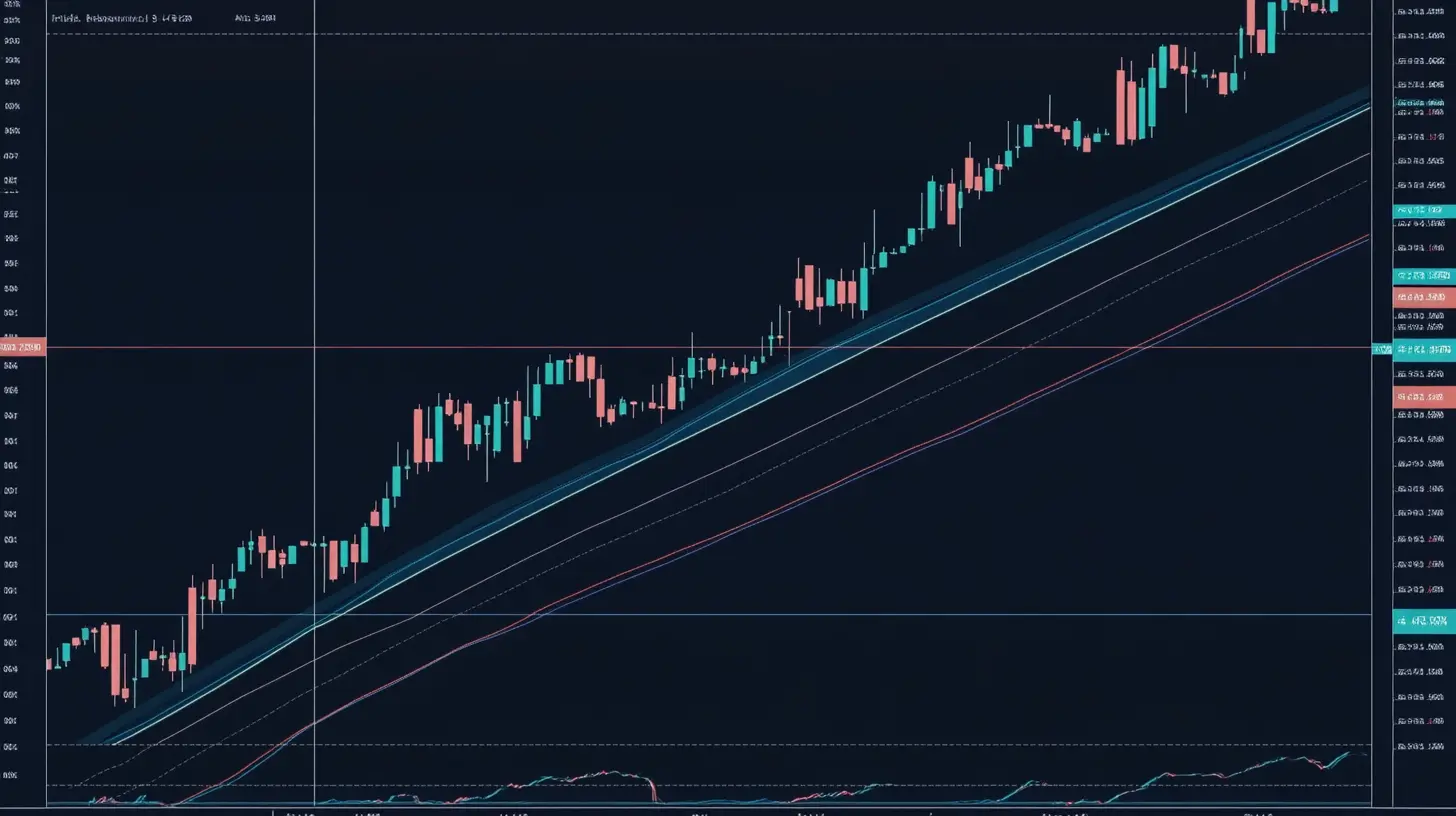
Intraday Chart Signals
On a 240-minute chart, WTI is trading within an ascending pitchfork pattern originating from the December lows. Near-term resistance is reinforced at $73.87-$73.91, with support at $71.90-$72.45 and critical backing at $71.33. A failure to hold above $71.33 would negate the bullish structure, while a topside breach of $73.91 targets the next resistance zones at $75.55-$75.60 and $77.15-$78.00.
Key Levels to Watch
- Bullish Scenarios: A close above $73.91 signals uptrend continuation, with targets at $75.55-$75.60 and $77.15-$78.00.
- Bearish Risks: A break below $71.33 shifts focus to the $70.00 handle, invalidating the bullish outlook and potentially inviting deeper declines.
Bottom Line
WTI crude oil is at a critical juncture, attempting to break free from a six-month downtrend. While the bullish case remains intact above $71.33, sustained gains above $73.91 are necessary to fuel the next major advance. Traders should monitor the weekly close and reactions at key resistance levels for guidance.
Stay Updated
For more insights on oil trading strategies, follow our technical analysis updates. Watch key charts, including gold (XAU/USD), the US Dollar Index (DXY), and other major currency pairs, for broader market context.