The GBP/USD exchange rate is showing signs of potential weakness, with a bear-flag formation emerging on the charts. While recent gains have provided a temporary reprieve, the broader outlook suggests the recovery may remain vulnerable, particularly if the pair struggles to sustain momentum above key resistance levels.
Technical Outlook: GBP/USD Key Levels
- Support Levels:
- Immediate support is at the November low of 1.2487.
- A breach below this level would likely lead to a test of the May low at 1.2446.
- Further declines could target 1.2540, aligning with the 78.6% Fibonacci retracement.
- Resistance Levels:
- Key resistance lies at the 1.2710–1.2760 range, marked by the 23.6% Fibonacci extension and the 61.8% Fibonacci retracement.
- A sustained move above this zone could expose 1.2820 (38.2% Fibonacci extension) and the 1.2900–1.2910 region, defined by the 23.6% Fibonacci retracement and 50% Fibonacci extension.
- The 50-day SMA at 1.2932, which has a negative slope, remains a crucial barrier.
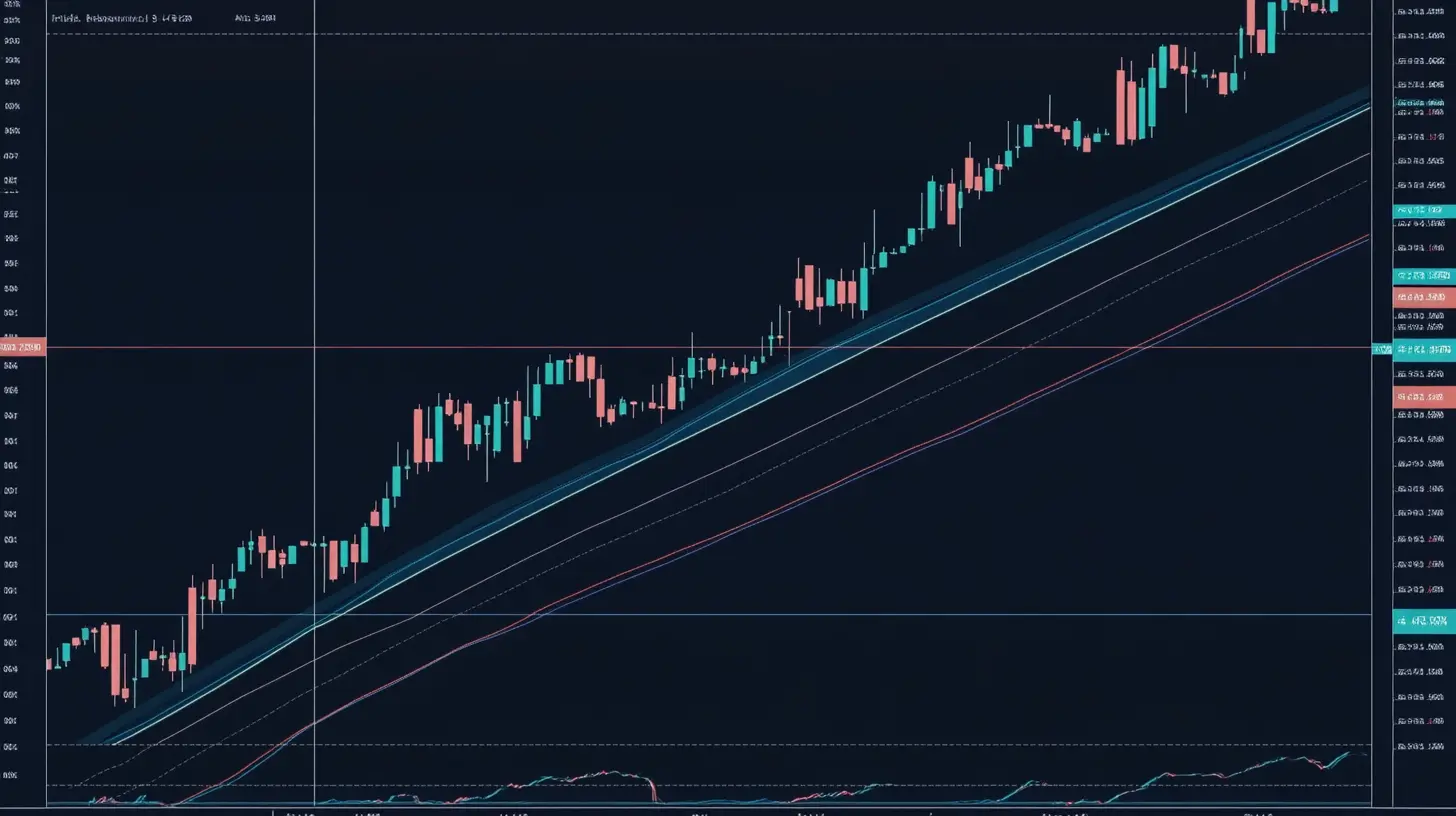
Bear Flag Formation and Potential Downside
GBP/USD has been carving an ascending channel, suggesting a temporary recovery. However, this movement appears to align with a bear-flag pattern, which typically precedes further declines in a downtrend. If the pair fails to close above the 1.2710–1.2760 resistance zone, the likelihood of a continuation of the bearish trend increases.
A break below the channel support could accelerate losses, pushing GBP/USD toward the May low at 1.2446. This would confirm the bearish continuation pattern and signal further downside risk.
Relative Strength Index (RSI) Signals Caution
The recent recovery has lifted the RSI out of oversold territory, indicating a potential short-term rebound. However, as long as the RSI remains below 50 and the 50-day SMA continues its downward slope, the broader bearish outlook remains intact.
Broader Context and Trading Strategy
While GBP/USD may trade within the November range in the near term, the overarching trend remains bearish. Traders should monitor the 1.2710–1.2760 resistance zone for signs of exhaustion. Failure to breach this level could present opportunities for short positions targeting support at 1.2540 and below.
A decisive weekly close will provide additional clarity on the pair’s direction, especially with fundamental events such as U.S. economic data releases and market sentiment influencing price action.
Stay nimble and watch for a breakout of the ascending channel to confirm the next major move in GBP/USD.