EUR/AUD’s sharp rally appears to be losing steam as April’s monthly candle closely resembles major tops seen in 2008 and 2020. Could a significant correction be on the horizon? Key support and resistance areas will be crucial to watch as we move into May.
EUR/AUD Monthly Chart Analysis: Is a Turnaround Imminent?
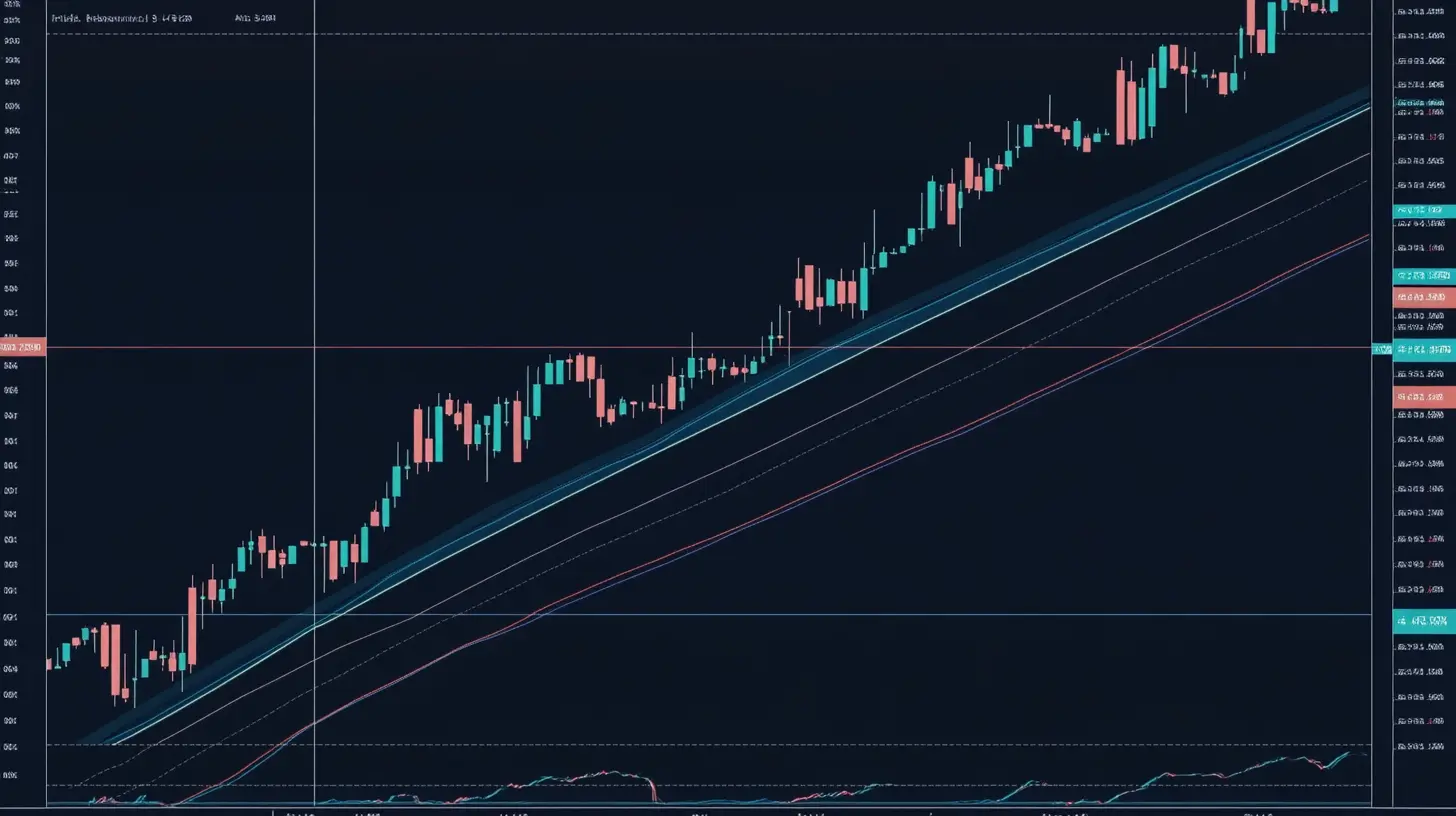
The surge in EUR/AUD from November’s low has been impressive, with the pair soaring by more than 16% through April’s peak. Notably, the pace of each upward swing has accelerated, suggesting strong momentum from the bulls. However, the intensity of the rally may now be tapering off, raising questions about its sustainability.
When we zoom out to the monthly timeframe, the April candlestick bears a striking resemblance to the patterns seen at the major highs of March 2020 and October 2008. Historically, both of those peaks were followed by prolonged periods of weakness: a two-year decline after 2020, and a four-year downturn after 2008. With only a couple of trading days remaining in April, it appears that the pair has surrendered more than half of its earlier monthly gains, just as it did during those previous significant turning points.
Adding to the cautionary signals, the monthly RSI (2) is now at its most overbought level since late 2017, suggesting that the pair might be ripe for a pullback.
While the monthly chart isn’t typically used for short-term trading decisions, it provides valuable context as we enter May. Even if a short-term bounce materializes, it could be challenging for EUR/AUD to revisit April’s high without a broader consolidation phase.
EUR/AUD Daily Chart Review: Signs of a Potential Short-Term Bounce
Looking at the daily chart, EUR/AUD has been in a steady retracement mode since reaching its April high. However, the downward momentum is showing signs of stalling, forming a falling wedge pattern often seen as a precursor to a bullish reversal.
Although projecting a precise target from this wedge pattern is challenging, a cautious upside projection toward the 1.80 level seems reasonable, aligning with previous consolidation zones.
Recent price action reveals that the pair is trying to stabilize above its 20-day exponential moving average (EMA). Moreover, the appearance of a bullish hammer and a doji candle suggests that sellers have been unable to drive the pair decisively lower. Importantly, the current lows are holding above the 1.76 support region, which is further strengthened by a 361.8% Fibonacci extension both critical levels to monitor.
Key Levels and Trading Strategy for EUR/AUD
- Short-term momentum leans towards a potential rebound toward the 1.80 handle.
- Support around 1.76 remains crucial for bulls; a drop below this level could invalidate the bullish case.
- On the broader view from the monthly chart, traders should watch for evidence of a lower swing high beneath April’s peak, which would support the idea that the major upward move is largely complete and that a deeper correction may unfold.